The Coffee Shop Line Is Costing You Sales
A coffee shop loses money when it mistakes a visible queue for a machine problem. The real constraint may be order-taking, customization, handoff, or the time a slow drink consumes at the busiest station. This document-first audiobook short translates public primary documents and MBA operations principles into an explicitly fictional, small-business scenario.
By MyAudioBooks.ai ·
Listen free: The Coffee Shop Line Is Costing You Sales
Starbucks’ fiscal 2025 Form 10-K reports $17.1 billion in store operating expenses, equal to 45.9 percent of total net revenue. Product and distribution costs added another $11.7 billion, or 31.4 percent. Those are chain-wide figures, not a neighborhood benchmark. They show why a cafe has to count labor, ingredients, equipment, and handoff instead of treating the selling price as profit.
Our verdict is that a coffee shop loses money when it mistakes a visible queue for a machine problem. The slowest step is the bottleneck, the stage that limits completed orders. A new espresso machine will not fix a cashier, customization, or pickup bottleneck. First measure what arrives, what gets finished, and where the ticket stops moving. At Milepost, the handoff is the bottleneck, not the machine. Nia, the fictional owner, has six Saturday ticket logs but has not yet timed the stations that turn each paid order into a finished cup. That is the missing measurement, and it is why a twelve-thousand-dollar purchase would be premature.
At My Audio Books dot A I, you can create your own audiobooks from prompts, turn your documents into audio, and store everything in your personal library.
The Queue at Milepost Coffee
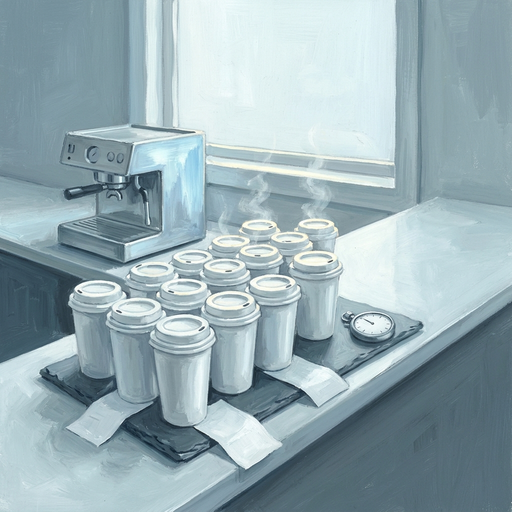
Milepost Coffee is a fictional neighborhood shop. Nia owns it, and Jalen is its Saturday barista. On Saturday morning, Nia sees a line curl out the door and starts shopping for a second espresso machine. It costs $12,000 installed. The machine looks like the problem because it is the loudest object in the room.
Nia checks point-of-sale tickets from six recent Saturday rushes. During the busiest two hours, the shop averages thirty-four arriving orders per hour. Jalen and the team finish twenty-eight. Each hour, six more orders enter the line than leave it. Over two hours, the backlog grows by twelve orders if nobody walks away.
That subtraction is the only queue math Nia needs at first. Thirty-four orders arrive; twenty-eight are completed; six wait. The backlog is not a metaphor. It is twelve tickets still visible when the rush ends, some of them attached to customers who are already asking for a refund.
Nia and Jalen then time each station for a week. The register can take forty orders an hour. The espresso station can finish thirty-two when the drinks are standard. The handoff counter clears twenty-eight orders an hour because one person is answering questions, finding mobile tickets, and correcting cups that were placed on the wrong shelf.
The machine was not the first bottleneck. The handoff station was. Buying another espresso machine would have made more drinks arrive at an already crowded counter. The shop would spend twelve thousand dollars to create a more expensive queue.
Read the 10-K Without Copying Its Ratios
Starbucks reported fiscal 2025 company-operated-store revenue of $30.7 billion and total net revenue of $37.2 billion. The same statements report $17.1 billion in store operating expenses, equal to 45.9 percent of total net revenue. Product and distribution costs were $11.7 billion, or 31.4 percent of total net revenue.
The filing defines store operating expenses to include wages and benefits, occupancy, marketing, delivery commissions, and other costs that directly support store operations. That is the company’s accounting category, not a margin target for a one-location cafe. Starbucks has licensed stores, corporate functions, national purchasing, and a much larger operating system than Milepost.
B L S reports a May 2025 median hourly wage of $15.24 for food and beverage serving and related workers. It is a national occupation-level statistic, not an offer letter for the fictional shop or a local barista wage. Before using any benchmark, Milepost must check that the numerator, denominator, company-operated share, and labor market actually match.
The filing still makes one point hard to avoid: selling more drinks does not mean the owner keeps the whole ticket. Ingredients and distribution, store labor, occupancy, and other operating needs take their shares before corporate expense and depreciation are paid. The owner needs a measured operating system, not a chain’s headline sales, to decide whether another machine will earn its keep.
Throughput Is the Product
“Throughput” is the number of orders a shop actually completes in a period. Sales reports show what was paid for. Throughput shows how fast the operating system converts a customer into a finished order.
When arrivals stay below the slowest station’s capacity, a line can recover between peaks. When arrivals exceed that capacity, waiting work accumulates. Utilization is the share of a station’s capacity already in use. At very high utilization, small interruptions can create disproportionately long waits: a refund, a mobile-order remake, a milk change, or a broken card reader can ripple through the whole line.
Nia had been staring at the espresso machine because it was visible. Jalen’s ticket log pointed to a different task: order handoff. Jalen finished the drink, but customers could not find it. Mobile orders and walk-in drinks sat together. Two cups had the same first name. Luis, the shift lead, made the same espresso twice while trying to clear both channels.
That is an information problem disguised as a speed problem. The shop adds a pickup shelf divided into clear zones, labels each cup with the full order name, and gives one worker responsibility for calling and clearing completed drinks. It keeps the espresso machine unchanged.
On the next Saturday, Nia and Jalen measure the same things as before. How many orders arrived in each fifteen-minute block? How many were finished? How many were remade? How long did a finished cup wait before pickup? The point is not to collect data forever. The point is to test whether the intervention changes the step that was actually slow.
A Second Barista May Be the Right Answer
There are days when labor is the binding constraint. “Binding” means the resource is fully used and prevents the shop from making more sales. If the barista station is the limit, a second trained worker can create capacity. If the machine, register, or pickup counter is the limit, another barista may simply move the queue.
Nia runs a one-week trial. Jalen takes orders and handles payment, while Luis stays at the drink station. A third person joins only for the two-hour Saturday peak, with a narrow job: stage milks, call names, reconcile mobile orders, and keep the pickup area moving. Nia records the labor cost and the number of additional completed orders rather than calling the shift a success because the room feels calmer.
The right test is incremental contribution. If the extra peak worker costs $40 for the shift, the shift must generate more than $40 in additional contribution, not merely $40 in sales. Contribution is sales minus the costs that rise with each order, such as ingredients, cup, lid, and payment fees.
Suppose Nia’s trial clears ten extra orders and each contributes about four dollars after those variable costs. That is roughly $40 of additional contribution. Nia has covered the wage for that shift before taxes, scheduling risk, or any other expense. If the trial clears fifteen additional orders, the same shift contributes about $60 before those additional costs. Now Nia has a reason to test the schedule again.
The assumptions are illustrative. Nia must use Milepost’s own payroll, recipe costs, and transaction records. A national wage median cannot tell her whether one local shift pays for itself.
The Slow Drink Has a Hidden Price
A drink can have a high dollar margin and still be a bad use of the busiest worker’s time. A seasonal custom latte may sell for $7.50 and use $2.10 of ingredients and packaging. It leaves $5.40 before other costs. If it takes two and a half minutes of constrained barista time, its contribution is about $2.16 per barista-minute.
A drip coffee may sell for $4.00 and use $0.80 of ingredients and packaging. It leaves $3.20 before other costs. If the final pour and handoff require half a minute of barista time, it generates about $6.40 per constrained minute.
Those example inputs do not prove that drip coffee is always the better product. They show why the owner must identify the resource that limits sales. If espresso labor is scarce during the rush, the relevant comparison is not just contribution per cup. It is contribution per minute of the scarce station, plus what the customer values and what can be prepared in advance.
“Contribution per constrained minute” is a way to compare items by the minutes they consume at the station that is already full. It is not a complete menu-pricing formula. A drink can support the brand, attract new customers, or lift basket size. But if a slow, low-contribution item occupies the only barista during a rush, it has an opportunity cost.
Nia does not need to ban custom drinks. She can offer the full menu all day while making the peak menu easier to execute. The menu board can identify a few fast favorites. Mobile ordering can ask for modifications in a consistent format. Jalen can prepare the ingredients that are safe and appropriate to stage before the rush.
The best seller is not always the item with the highest ticket. It may be the item that creates the most contribution without consuming the scarce minutes needed to finish other orders.
The Peak Menu Is a Pricing Choice
Milepost does not need to delete every slow drink. It can divide the offer by time. During the breakfast rush, the board highlights the drinks that the team can make consistently and quickly. The longer custom drinks remain available, but the customer can see which ones take extra time or cost more.
That is a form of “price architecture,” the way a business designs a set of choices so customers can select a level of service or customization. The shop can offer a standard latte, a premium seasonal drink, and a custom version with a clear charge for extra ingredients. The purpose is not to punish customers for preferences. It is to stop the owner from giving away labor-intensive options at the price of a simpler cup.
The menu has to match the station. If the espresso bar is the constraint, pushing drip coffee alone may not help. If the cashier and handoff are the constraint, a clearer menu and pickup process may be more valuable than reducing drink variety. Measure the work at the exact step that is limiting completions.
The peak menu can also be tested without making a permanent change. Keep the full menu on one Saturday, then test a highlighted short list on a comparable Saturday. Track completions, remakes, order mix, average ticket, and customer complaints. If throughput rises but contribution falls, the shop has made the line faster and the business weaker.
At My Audio Books dot A I, you can listen to this investigation and thousands of others that explain the hidden systems behind the headlines.
Measure the Line Before Buying the Machine
Before signing a purchase order, the owner should map the path from arrival to handoff. Count orders. Time the register. Time drink production. Time handoff. Record remakes and cancellations. Ask which station is busy while another waits.
A four-hour observation may reveal that the espresso machine is idle while the cashier explains the loyalty program. It may reveal that a drink is finished but cannot be handed over because the pickup counter is blocked. It may show that the grinder is at capacity or that custom modifiers create a repeated sequence of interruptions. The fix depends on the observation.
A machine purchase can still be the right call. It is right when a measured test shows that the machine is the bottleneck, the new equipment reliably raises completed orders, and the extra contribution can cover the full cost of buying, installing, maintaining, and financing it. A quote that lists only the machine’s purchase price is incomplete.
The owner should also consider failure risk. A second machine can reduce downtime if the first breaks. It can also add cleaning, calibration, repairs, and a larger menu of technical failures. More equipment is not automatically more capacity. Capacity is the orders the whole system can complete.
The Payback Test, Spoken Plainly
Milepost’s second machine costs twelve thousand dollars installed. The owner does not ask whether it looks busy. The owner asks how many additional paid orders the machine lets the whole shop finish, after the register, barista, and handoff steps are counted.
Suppose a controlled trial shows that the machine would add eight completed orders per hour during a two-hour rush, five days a week. That is eighty additional orders a week. If each one leaves three dollars of contribution after ingredients, packaging, and transaction costs, the extra contribution is about $240 a week, or about $12,000 over fifty weeks.
That is only a simple payback estimate. It ignores financing, maintenance, repairs, cleaning time, downtime, taxes, and whether demand really stays at that level. If the new machine does not increase completed orders because the pickup shelf is still the bottleneck, its incremental contribution is zero and the payback never arrives.
The owner should track a baseline, change one thing, and run the same measurement again. If two fixes are tested together, nobody knows which one created the improvement. If a special event changes customer arrivals, compare like days or mark the event rather than calling it ordinary demand.
A second machine can be a smart investment after the flow test. Before that, it is an expensive guess. The twelve-thousand-dollar decision should be supported by completed orders and contribution, not by a line that looks long from the front door.
The Best Argument for More Equipment
The strongest case against our verdict is that a crowded queue is itself a customer experience problem. People may abandon it, choose another shop, or decide that mobile ordering is more reliable. A neighborhood business cannot tell customers to wait indefinitely while it performs a perfect time study.
That objection wins on urgency. We’d argue that Nia should respond quickly enough to protect customers, perhaps by changing the pickup flow or adding a short-term peak shift. It loses when she assumes capital equipment is the only fast response. A temporary staffing trial, a clearer pickup shelf, or a smaller peak menu may be tested within days rather than financed for years.
A queue is a living process, not an abstract average. Orders arrive in bursts. A mobile order may land at the same time as a family of four. Milk substitutions add work. A new employee may need a different station assignment. The manager has to remeasure after each material change.
The practical target is not zero waiting. A cafe with no line may have paid for more capacity than its customers use. The target is a service promise the shop can meet at the times customers value most, with enough slack to absorb normal variation.
What Would Prove Us Wrong
Three observations would prove us wrong about waiting to buy the machine. If timed rushes show the espresso station is consistently full while the register and handoff counter have slack, the machine may be the constraint. If a controlled equipment trial increases completed orders and contribution after maintenance and labor costs, the purchase may pay. If refunds and abandoned tickets continue after Nia fixes pickup and staffing, the cost of waiting may be higher than the cost of capacity.
Those findings would change the recommendation. The owner should not defend a process fix after the actual bottleneck moves; she should measure again and invest where the system is now constrained.
A Weekly Operating Card
Milepost builds a one-page card for each peak period. It records arriving orders, completed orders, average ticket time, remakes, refunds, product mix, and staff hours. Revenue by hour is shown beside contribution by hour. That is enough to ask whether the shop sold more or merely became busier.
If the queue grows for three Saturdays in a row, the owner tests one operational change at a time. If the queue clears but labor cost rises faster than contribution, the staffing plan is too expensive. If waits improve and the customer count rises, the owner may have found a capacity investment worth keeping.
The word “average” can conceal a bad peak. A shop can look comfortably staffed over the full day and still be unable to serve the breakfast rush. The staffing plan should match the pattern of arrivals, not the daily mean. The owner can look at fifteen-minute blocks without building a complicated simulation.
The scorecard also prevents a familiar argument. The cashier says the barista is slow. The barista says the orders are too complicated. The owner says the machine is old. A ticket log can show which station was busy, how long it stayed busy, and whether the delay ended before or after the drink was made.
What the Owner Should Do Monday
First, pull the last four weeks of point-of-sale data by fifteen-minute interval. Do not begin with a full-year average. Circle the periods when arrivals exceed completed orders.
Second, watch a peak shift without interrupting it. Record the handoffs between order-taking, payment, drink-making, and pickup. If the shop has several channels, mark whether each order came from the counter, mobile app, or delivery platform.
Third, estimate the contribution of the top five drinks. Use selling price minus the ingredients, packaging, and transaction costs that change with the order. Do not allocate rent into every drink and then treat that as avoidable cost. Rent is still due whether the customer orders a mocha or a drip coffee.
Fourth, choose a reversible test. Move the pickup shelf, split tasks, simplify the peak menu, or add one short shift. Set a date to compare completed orders, wait time, labor hours, and remakes against the baseline.
Fifth, buy equipment only after the test identifies a machine constraint. The equipment decision should be built from additional completed orders and their contribution, not from the number of people visible in the line.
The Price of a Faster Cup
A faster line costs something. It may cost a wage premium, fewer menu options during a peak, a redesigned counter, or a new machine. The owner has to decide which cost produces value customers can feel and the shop can keep.
We think a coffee shop should treat waiting time as an operating cost, but not confuse the queue with its cause. Starbucks’ 10-K shows that labor, occupancy, product, delivery, and other store costs sit inside the retail equation. B L S wage data gives a national reference for food-service work, not a local staffing plan. Milepost’s own tickets and station measurements decide whether the next dollar belongs in equipment, labor, or process design.
The coffee shop line is costing sales only when the shop can show which orders it fails to finish, which customers abandon, and what those orders would have contributed. Once the owner knows that, a second machine is no longer a guess. It is a capital decision that can be tested against a bottleneck, a customer promise, and a real cash return.
At My Audio Books dot A I, you can create fiction, non-fiction, and audio from your own documents, all in one library. Learn more today at My Audio Books dot A I.
A line is visible. The constraint is often hidden. Measure the work, find the station that limits completed orders, and spend only where the flow can use the capacity. The shop does not need the biggest machine in town. It needs a system that turns a customer’s minute into a finished cup before the customer gives that minute to someone else. At Milepost, the handoff is the bottleneck, not the machine.